tags: addons, dashboard
09-2.部署 dashboard 插件
修改配置文件
将下载的 kubernetes-server-linux-amd64.tar.gz 解压后,再解压其中的 kubernetes-src.tar.gz 文件。
dashboard 对应的目录是:cluster/addons/dashboard。
$ pwd
/opt/k8s/kubernetes/cluster/addons/dashboard

$ cp dashboard-controller.yaml{,.orig}

$ diff dashboard-controller.yaml{,.orig}
33c33
<         image: siriuszg/kubernetes-dashboard-amd64:v1.8.3
---
>         image: k8s.gcr.io/kubernetes-dashboard-amd64:v1.8.3

$ cp dashboard-service.yaml{,.orig}

$ diff dashboard-service.yaml.orig dashboard-service.yaml
10a11
>   type: NodePort
- 指定端口类型为 NodePort,这样外界可以通过地址 nodeIP:nodePort 访问 dashboard;
执行所有定义文件
$ ls *.yaml
dashboard-configmap.yaml  dashboard-controller.yaml  dashboard-rbac.yaml  dashboard-secret.yaml  dashboard-service.yaml

$ kubectl create -f  .
查看分配的 NodePort
$ kubectl get deployment kubernetes-dashboard  -n kube-system
NAME                   DESIRED   CURRENT   UP-TO-DATE   AVAILABLE   AGE
kubernetes-dashboard   1         1         1            1           2m

$ kubectl --namespace kube-system get pods -o wide
NAME                                    READY     STATUS    RESTARTS   AGE       IP            NODE
coredns-77c989547b-6l6jr                1/1       Running   0          58m       172.30.39.3   kube-node3
coredns-77c989547b-d9lts                1/1       Running   0          58m       172.30.81.3   kube-node1
kubernetes-dashboard-65f7b4f486-wgc6j   1/1       Running   0          2m        172.30.81.5   kube-node1

$ kubectl get services kubernetes-dashboard -n kube-system
NAME                   TYPE       CLUSTER-IP      EXTERNAL-IP   PORT(S)        AGE
kubernetes-dashboard   NodePort   10.254.96.204   <none>        443:8607/TCP   2m
- NodePort 8607 映射到 dashboard pod 443 端口;
dashboard 的 --authentication-mode 支持 token、basic,默认为 token。如果使用 basic,则 kube-apiserver 必须配置 '--authorization-mode=ABAC' 和 '--basic-auth-file' 参数。
查看 dashboard 支持的命令行参数
$ kubectl exec --namespace kube-system -it kubernetes-dashboard-65f7b4f486-wgc6j  -- /dashboard --help
2018/06/13 15:17:44 Starting overwatch
Usage of /dashboard:
      --alsologtostderr                   log to standard error as well as files
      --apiserver-host string             The address of the Kubernetes Apiserver to connect to in the format of protocol://address:port, e.g., https://localhost:8080. If not specified, the assumption is that the binary runs inside a Kubernetes cluster and local discovery is attempted.
      --authentication-mode stringSlice   Enables authentication options that will be reflected on login screen. Supported values: token, basic. Default: token.Note that basic option should only be used if apiserver has '--authorization-mode=ABAC' and '--basic-auth-file' flags set. (default [token])
      --auto-generate-certificates        When set to true, Dashboard will automatically generate certificates used to serve HTTPS. Default: false.
      --bind-address ip                   The IP address on which to serve the --secure-port (set to 0.0.0.0 for all interfaces). (default 0.0.0.0)
      --default-cert-dir string           Directory path containing '--tls-cert-file' and '--tls-key-file' files. Used also when auto-generating certificates flag is set. (default "/certs")
      --disable-settings-authorizer       When enabled, Dashboard settings page will not require user to be logged in and authorized to access settings page.
      --enable-insecure-login             When enabled, Dashboard login view will also be shown when Dashboard is not served over HTTPS. Default: false.
      --heapster-host string              The address of the Heapster Apiserver to connect to in the format of protocol://address:port, e.g., https://localhost:8082. If not specified, the assumption is that the binary runs inside a Kubernetes cluster and service proxy will be used.
      --insecure-bind-address ip          The IP address on which to serve the --port (set to 0.0.0.0 for all interfaces). (default 127.0.0.1)
      --insecure-port int                 The port to listen to for incoming HTTP requests. (default 9090)
      --kubeconfig string                 Path to kubeconfig file with authorization and master location information.
      --log_backtrace_at traceLocation    when logging hits line file:N, emit a stack trace (default :0)
      --log_dir string                    If non-empty, write log files in this directory
      --logtostderr                       log to standard error instead of files
      --metric-client-check-period int    Time in seconds that defines how often configured metric client health check should be run. Default: 30 seconds. (default 30)
      --port int                          The secure port to listen to for incoming HTTPS requests. (default 8443)
      --stderrthreshold severity          logs at or above this threshold go to stderr (default 2)
      --system-banner string              When non-empty displays message to Dashboard users. Accepts simple HTML tags. Default: ''.
      --system-banner-severity string     Severity of system banner. Should be one of 'INFO|WARNING|ERROR'. Default: 'INFO'. (default "INFO")
      --tls-cert-file string              File containing the default x509 Certificate for HTTPS.
      --tls-key-file string               File containing the default x509 private key matching --tls-cert-file.
      --token-ttl int                     Expiration time (in seconds) of JWE tokens generated by dashboard. Default: 15 min. 0 - never expires (default 900)
  -v, --v Level                           log level for V logs
      --vmodule moduleSpec                comma-separated list of pattern=N settings for file-filtered logging
command terminated with exit code 2
$
访问 dashboard
为了集群安全,从 1.7 开始,dashboard 只允许通过 https 访问,如果使用 kube proxy 则必须监听 localhost 或 127.0.0.1,对于 NodePort 没有这个限制,但是仅建议在开发环境中使用。
对于不满足这些条件的登录访问,在登录成功后浏览器不跳转,始终停在登录界面。
参考:
https://github.com/kubernetes/dashboard/wiki/Accessing-Dashboard---1.7.X-and-above
https://github.com/kubernetes/dashboard/issues/2540
- kubernetes-dashboard 服务暴露了 NodePort,可以使用
https://NodeIP:NodePort地址访问 dashboard; - 通过 kube-apiserver 访问 dashboard;
- 通过 kubectl proxy 访问 dashboard:
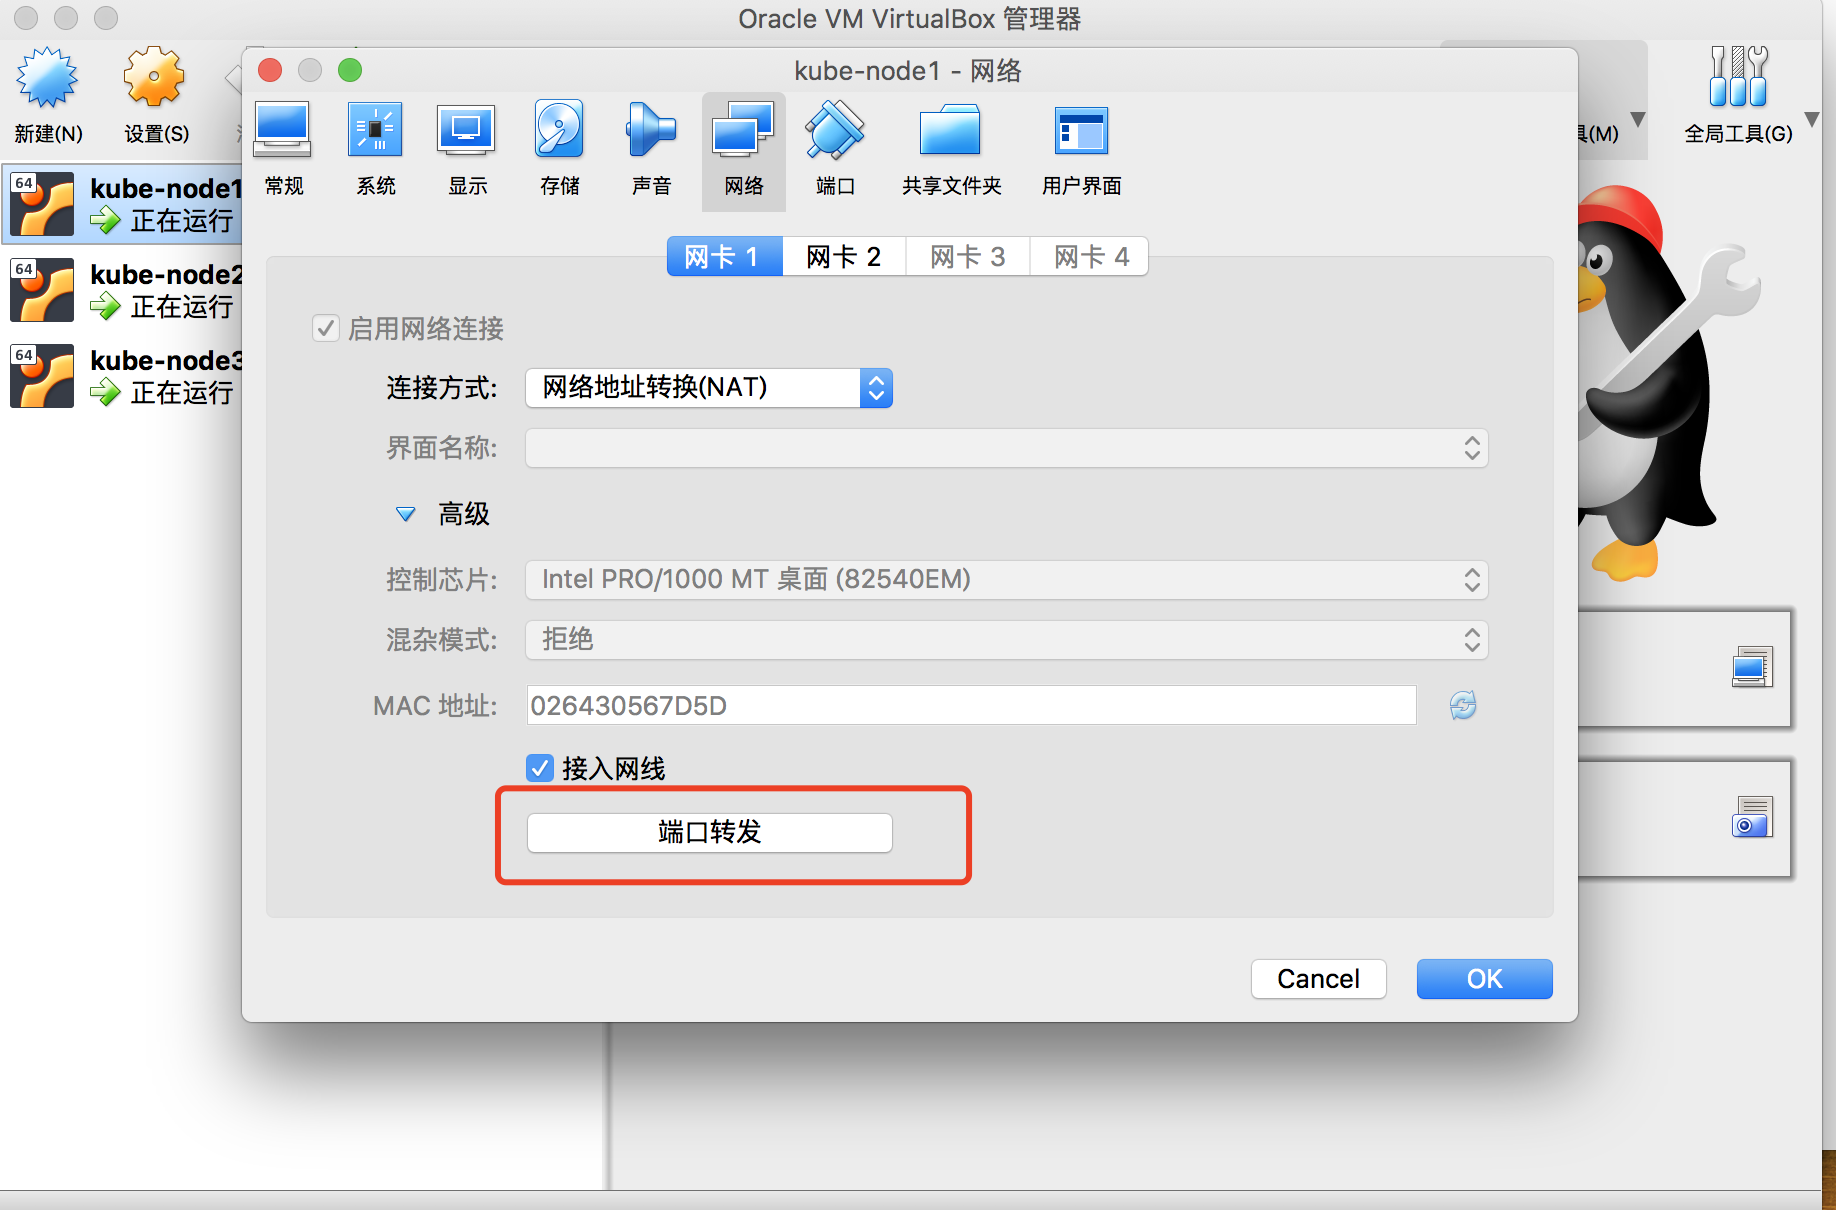
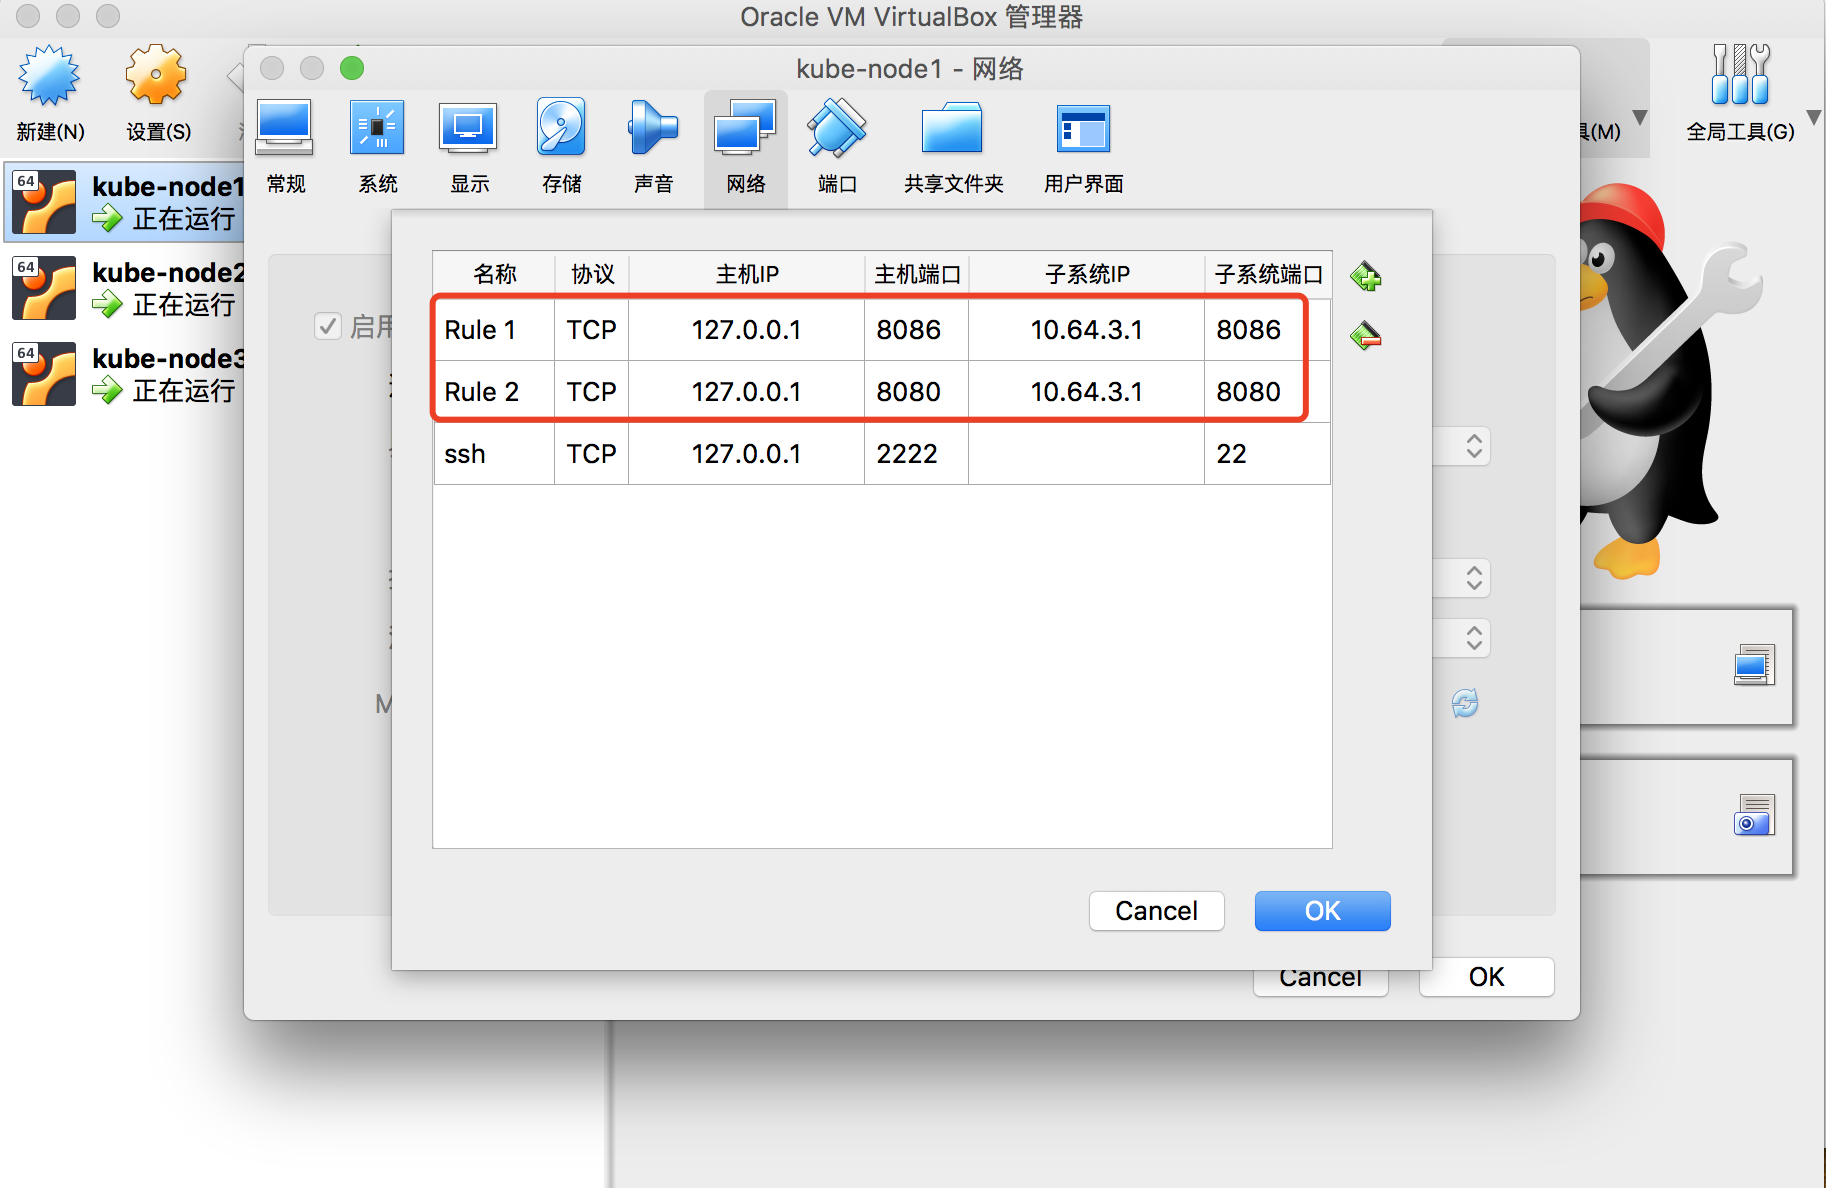
如果使用了 VirtualBox,需要启用 VirtualBox 的 ForworadPort 功能将虚机监听的端口和 Host 的本地端口绑定。
可以在 Vagrant 的配置中指定这些端口转发规则,对于正在运行的虚机,也可以通过 VirtualBox 的界面进行配置:
通过 kubectl proxy 访问 dashboard
启动代理:
$ kubectl proxy --address='localhost' --port=8086 --accept-hosts='^*$'
Starting to serve on 127.0.0.1:8086
- --address 必须为 localhost 或 127.0.0.1;
- 需要指定
--accept-hosts选项,否则浏览器访问 dashboard 页面时提示 “Unauthorized”;
浏览器访问 URL:https://127.0.0.1:8086/api/v1/namespaces/kube-system/services/https:kubernetes-dashboard:/proxy
通过 kube-apiserver 访问 dashboard
获取集群服务地址列表:
$ kubectl cluster-info
Kubernetes master is running at https://172.27.129.105:6443
CoreDNS is running at https://172.27.129.105:6443/api/v1/namespaces/kube-system/services/coredns:dns/proxy
kubernetes-dashboard is running at https://172.27.129.105:6443/api/v1/namespaces/kube-system/services/https:kubernetes-dashboard:/proxy

To further debug and diagnose cluster problems, use 'kubectl cluster-info dump'.
必须通过 kube-apiserver 的安全端口(https)访问 dashbaord,访问时浏览器需要使用自定义证书,否则会被 kube-apiserver 拒绝访问。
创建和导入自定义证书的步骤,参考:A.浏览器访问kube-apiserver安全端口
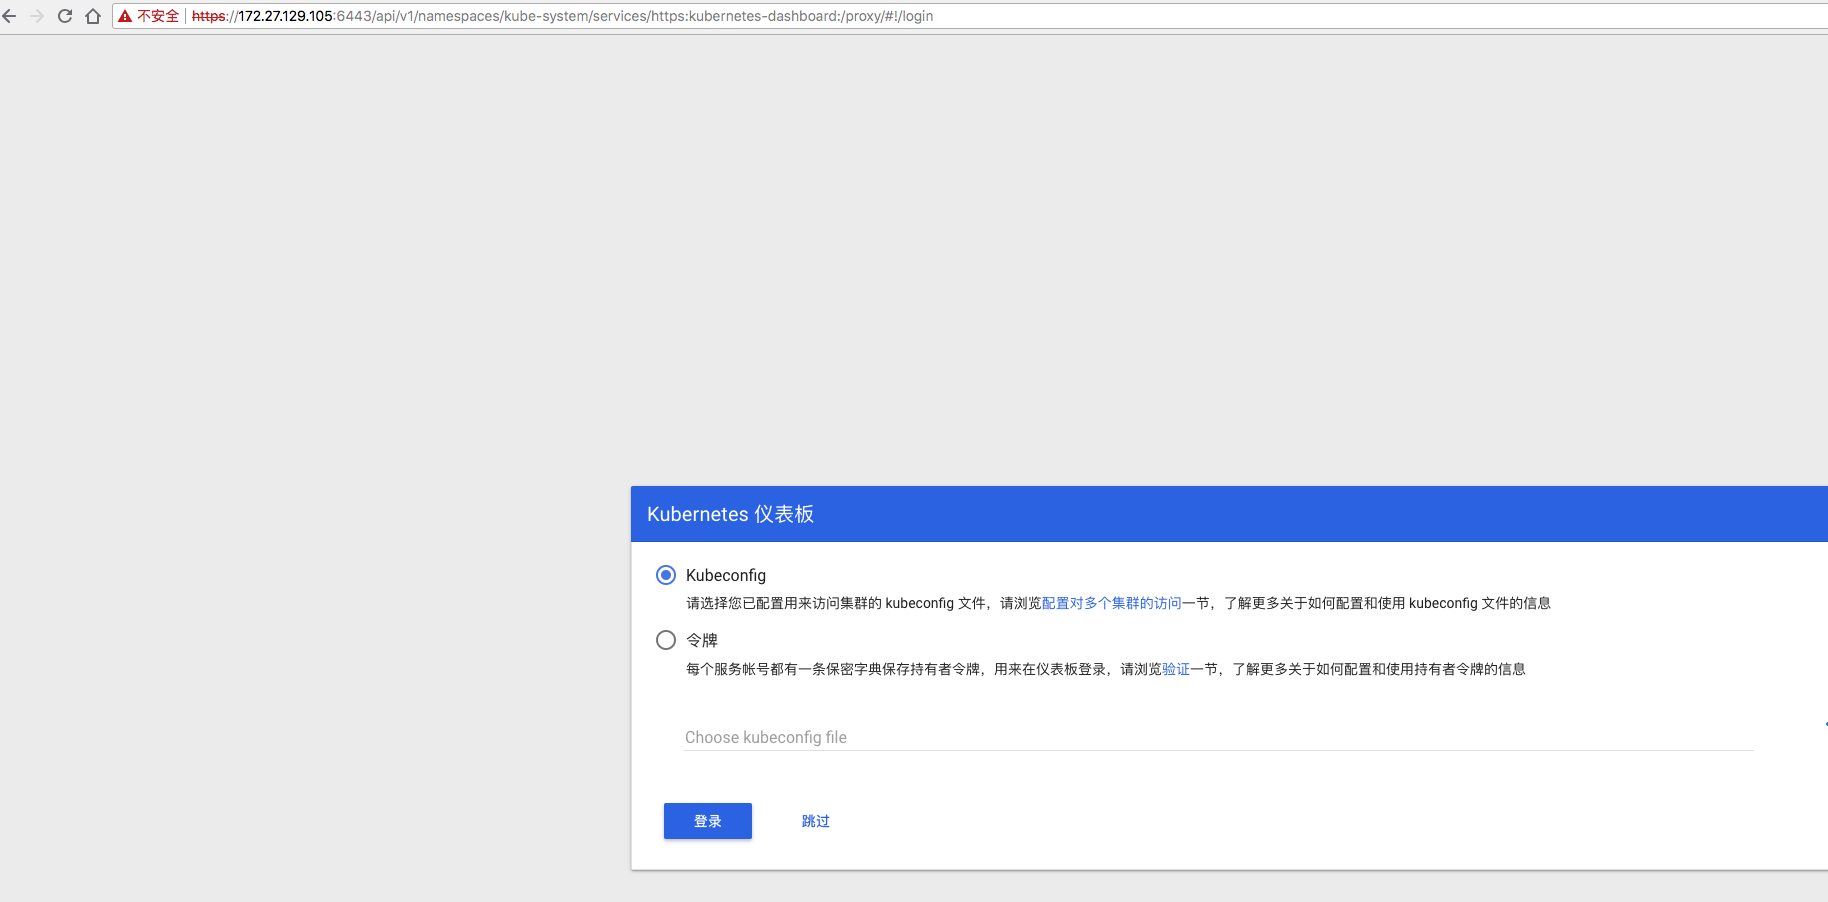
浏览器访问 URL:https://172.27.129.105:6443/api/v1/namespaces/kube-system/services/https:kubernetes-dashboard:/proxy/
对于 virtuabox 做了端口映射: https://127.0.0.1:6443/api/v1/namespaces/kube-system/services/https:kubernetes-dashboard:/proxy/
创建登录 Dashboard 的 token 和 kubeconfig 配置文件
上面提到,Dashboard 默认只支持 token 认证,所以如果使用 KubeConfig 文件,需要在该文件中指定 token,不支持使用 client 证书认证。
创建登录 token
kubectl create sa dashboard-admin -n kube-system
kubectl create clusterrolebinding dashboard-admin --clusterrole=cluster-admin --serviceaccount=kube-system:dashboard-admin
ADMIN_SECRET=$(kubectl get secrets -n kube-system | grep dashboard-admin | awk '{print $1}')
DASHBOARD_LOGIN_TOKEN=$(kubectl describe secret -n kube-system ${ADMIN_SECRET} | grep -E '^token' | awk '{print $2}')
echo ${DASHBOARD_LOGIN_TOKEN}
使用输出的 token 登录 Dashboard。
创建使用 token 的 KubeConfig 文件
source /opt/k8s/bin/environment.sh
# 设置集群参数
kubectl config set-cluster kubernetes \
  --certificate-authority=/etc/kubernetes/cert/ca.pem \
  --embed-certs=true \
  --server=${KUBE_APISERVER} \
  --kubeconfig=dashboard.kubeconfig

# 设置客户端认证参数,使用上面创建的 Token
kubectl config set-credentials dashboard_user \
  --token=${DASHBOARD_LOGIN_TOKEN} \
  --kubeconfig=dashboard.kubeconfig

# 设置上下文参数
kubectl config set-context default \
  --cluster=kubernetes \
  --user=dashboard_user \
  --kubeconfig=dashboard.kubeconfig

# 设置默认上下文
kubectl config use-context default --kubeconfig=dashboard.kubeconfig
用生成的 dashboard.kubeconfig 登录 Dashboard。
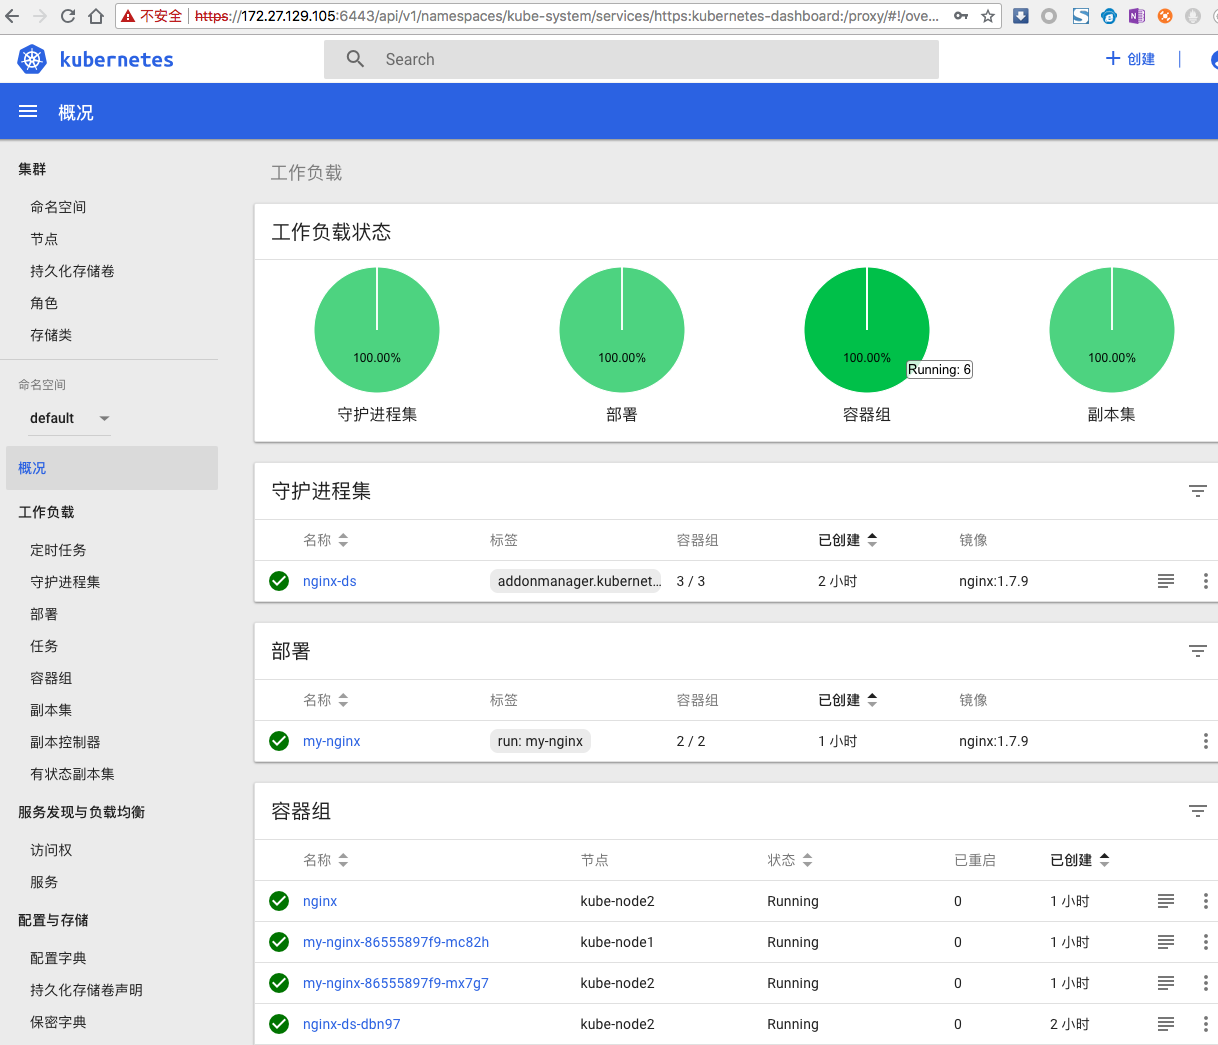
由于缺少 Heapster 插件,当前 dashboard 不能展示 Pod、Nodes 的 CPU、内存等统计数据和图表;
参考
https://github.com/kubernetes/dashboard/wiki/Access-control
https://github.com/kubernetes/dashboard/issues/2558
https://kubernetes.io/docs/concepts/configuration/organize-cluster-access-kubeconfig/


kubectl cluster-info之后访问地址401呀,有解决办法吗
401是权限问题,你看看
kubectl的证书对不对。