本篇是一篇hello world风格的入门指南,使用一个简单的例子,向大家演示怎么样安装、配置和使用Prometheus。你可以下载和本地运行Prometheus服务,通过配置文件收集Prometheus服务自己产生的数据,并在这些收集数据的基础上,进行查询、制定规则和图表化显示所关心的数据
下载和运行Prometheus
最新稳定版下载地址,选择合适的平台,然后提取并运行它
tar -xvf prometheus-*.tar.gz
cd prometheus-*
在运行Prometheus服务之前,我们需要指定一个该服务运行所需要的配置文件
监控自己
Prometheus通过Http方式拉取目标机上的度量指标。Prometheus服务也暴露自己运行所产生的数据,它能够抓取和监控自己的健康状况。
实际上,Prometheus服务收集自己运行所产生的时间序列数据,是没有什么意义的。但是它是一个非常好的入门级教程。保存以下的Prometheus配置到文件中,并自定义命名该文件名,如:prometheus.yml。
global:
  scrape_interval:     15s # By default, scrape targets every 15 seconds.

  # Attach these labels to any time series or alerts when communicating with
  # external systems (federation, remote storage, Alertmanager).
  external_labels:
    monitor: 'codelab-monitor'

# A scrape configuration containing exactly one endpoint to scrape:
# Here it's Prometheus itself.
scrape_configs:
  # The job name is added as a label `job=<job_name>` to any timeseries scraped from this config.
  - job_name: 'prometheus'

    # Override the global default and scrape targets from this job every 5 seconds.
    scrape_interval: 5s

    static_configs:
      - targets: ['localhost:9090']
完整的配置选项,可以查看文件文档
启动Prometheus服务
cd到Prometheus服务目录,并指定刚刚自定义好的配置文件,并启动Prometheus服务,如下所示:
# Start Prometheus.
# By default, Prometheus stores its database in ./data (flag --storage.tsdb.path).
./prometheus --config.file=prometheus.yml
Prometheus服务启动成功后,然后再打开浏览器在页面上数据 http://localhost:9090 。服务运行几秒后,会开始收集自身的时间序列数据
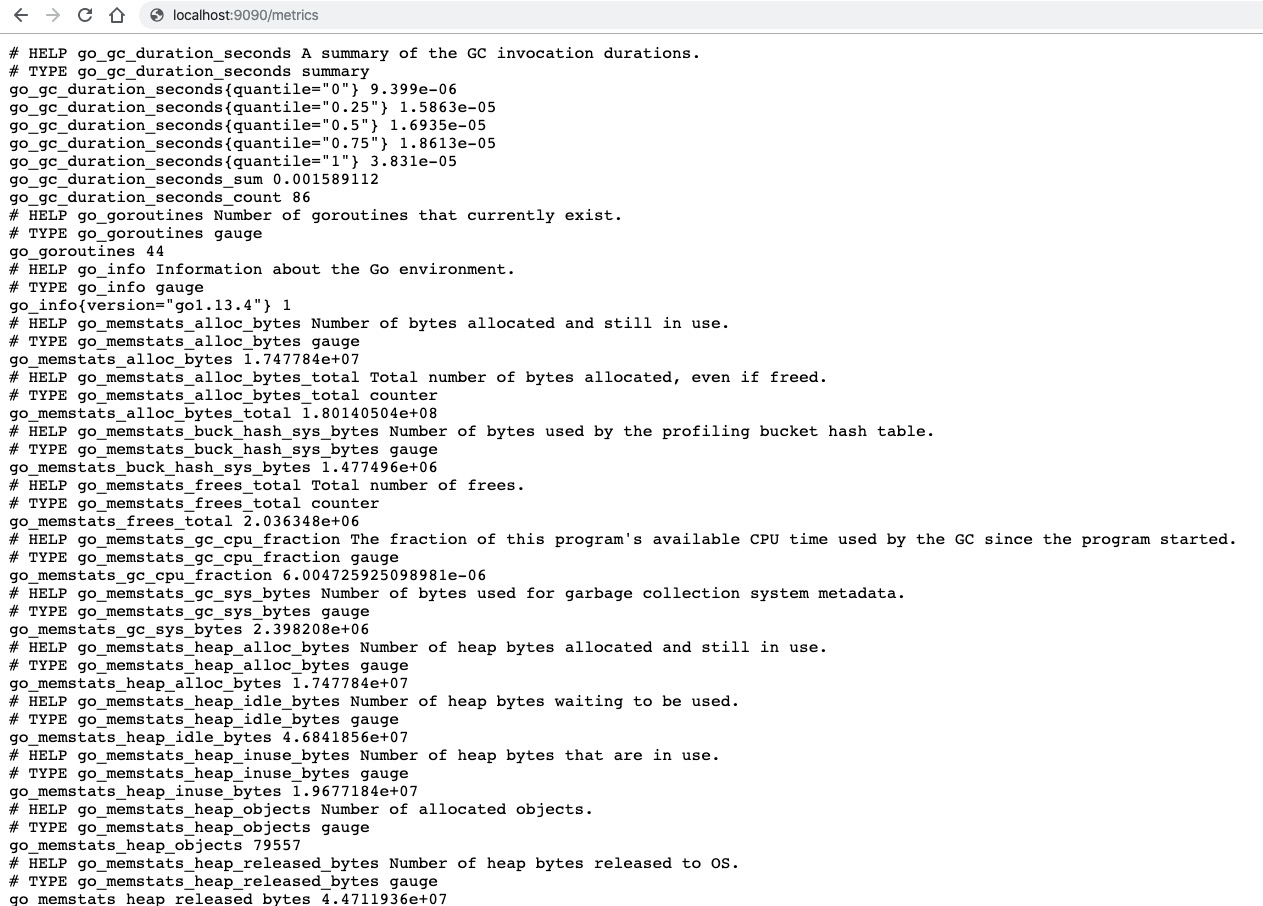
你也可以通过在浏览器输入 http://localhost:9090/metrics ,直接查看Prometheus服务收集到的自身数据
Prometheus服务执行的操作系统线程数量由GOMAXPROCS环境变量控制。从Go 1.5开始,默认值是可用的CPUs数量
盲目地设置GOMAXPROCS到一个比较高的值,有可能会适得其反。
注意:Prometheus服务默认需要3GB的内存代销。如果你的机器内存比较小, 你可以调整Prometheus服务使用更少的内存。详细见内存使用文档
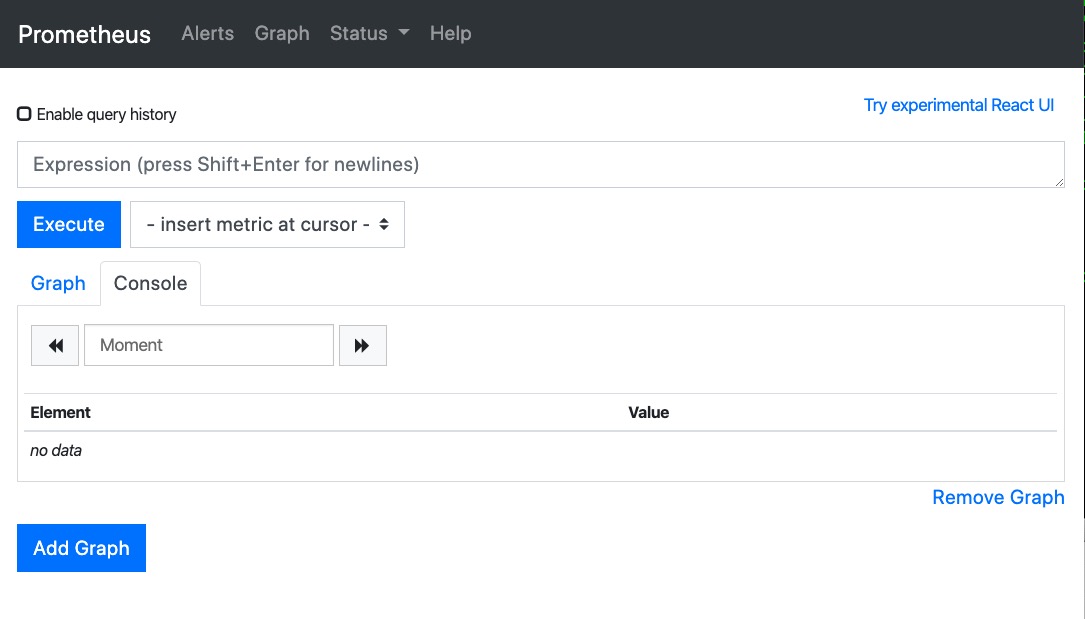
使用表达式浏览器
我们试着查看一些Prometheus服务自身产生的数据。为了使用Prometheus内置表达式浏览器,可以在浏览器中数据 http://localhost:9090/graph, 选择”Console”视图,同一层级还有”Graph”tab。
如果你可以从 http://localhost:9090/metrics 查看到收集的度量指标数据,那么其中有一个指标数据名称为prometheus_target_interval_length_seconds(两次抓取数据之间的时间差)可以被提取出来,可以在表达式控制框中输入:
prometheus_target_interval_length_seconds
它应该会返回带有prometheus_target_interval_length_seconds度量指标的许多时间序列数据,只是带有不能标签, 这些标签有不同的延迟百分比和目标群组之间的间隔。
如果我们仅仅对p99延迟感兴趣,我们使用下面的查询表达式收集该信息
prometheus_target_interval_length_seconds{quantile="0.99"}
为了统计时间序列数据记录的总数量,你可以写:
count(prometheus_target_interval_length_seconds)
更多的表达式语言,详见表达式语言文档
使用图形界面
使用 http://localhost:9090/graph 链接,查看图表”Graph”。
例如:输入下面的表达式,绘制在Prometheus服务中每秒存储的速率.
rate(prometheus_local_storage_chunk_ops_total[1m])
启动一些样本目标机
我们更感兴趣的是Prometheus服务抓取其他目标机的数据采样,并非自己的时间序列数据。Go客户库有一个例子,它会产生一些自己造的RPC延迟。启动三个带有不同的延时版本。
首先需要确保你有Go的环境
下载Go的Prometheus客户端,并运行下面三个服务:
# Fetch the client library code and compile example.
git clone https://github.com/prometheus/client_golang.git
cd client_golang/examples/random
go get -d
go build
# Start 3 example targets in separate terminals:
./random -listen-address=:8080
./random -listen-address=:8081
./random -listen-address=:8082
你现在应该浏览器输入http://localhost:8080/metrics, http://localhost:8081/metrics, 和 http://localhost:8082/metrics, 会看到这些服务所产生的度量指标数据.
配置Prometheus服务,监听样本目标实例
现在我们将配置Prometheus服务,收集这三个例子的度量指标数据。我们把这三个服务实例命名为一个任务称为example-random, 并把8080端口服务和8081端口服务作为生产目标group,8082端口成为canary group。 为了在Prometheus服务中建模这个,我们需要添加两个群组到这个任务中,增加一些标签到不同的目标群组中。在这个例子中,我们会增加group="production"标签到带个目标组中,另外一个则是group="canary"
为了达到这个目的,在prometheus.yml配置文件中,增加下面任务定义到scrape_config区域中, 并重启Prometheus服务:
scrape_configs:
  - job_name:       'example-random'
    # Override the global default and scrape targets from this job every 5 seconds.
    scrape_interval: 5s
    static_configs:
      - targets: ['localhost:8080', 'localhost:8081']
        labels:
          group: 'production'
      - targets: ['localhost:8082']
        labels:
          group: 'canary'
去表达式浏览器中验证Prometheus服务是否能统计到这两个群组的目标机度量数据,如:rpc_durations_seconds度量指标
为聚集到抓取的数据,设置规则并写入到新的时间序列中
当计算ad-hoc时,如果在累计到上千个时间序列数据的查询,可能会变慢。为了使这种多时间序列数据点查询更有效率,我们允许通过使用配置的记录规则,把预先记录表达式实时收集的数据存入到新的持久时间序列中。该例子中,如果我们对每秒RPCs数量(rpc_durations_seconds_count)的5分钟窗口流入的统计数量感兴趣的话。我们可以下面的表达式:
avg(rate(rpc_durations_seconds_count)[5m]) by (job, service)
试着使用图形化这个表达式
为了存储这个表达式所统计到的数据,我们可以使用新的度量指标,如job_service:rpc_durations_seconds_count:avg_rate5m,创建一个配置规则文件,并把该文件保存为prometheus.rules:
job_service:rpc_durations_seconds_count:avg_rate5m = avg(rate(rpc_durations_seconds_count[5m])) by (job, service)
为了使Prometheus服务使用这个新的规则,在prometheus.yml配置文件的global配置区域添加一个rule_files语句。这个配置应该向下面这样写:
global:
  scrape_interval:     15s # By default, scrape targets every 15 seconds.
  evaluation_interval: 15s # Evaluate rules every 15 seconds.
  # Attach these extra labels to all timeseries collected by this Prometheus instance.
  external_labels:
    monitor: 'codelab-monitor'
rule_files:
  - 'prometheus.rules'
scrape_configs:
  - job_name: 'prometheus'
    # Override the global default and scrape targets from this job every 5 seconds.
    scrape_interval: 5s
    static_configs:
      - targets: ['localhost:9090']
  - job_name:       'example-random'
    # Override the global default and scrape targets from this job every 5 seconds.
    scrape_interval: 5s
    static_configs:
      - targets: ['localhost:8080', 'localhost:8081']
        labels:
          group: 'production'
      - targets: ['localhost:8082']
        labels:
          group: 'canary'
指定这个新的配置文件,并重启Prometheus服务。验证新的时间序列度量指标job_service:rpc_durations_seconds_count:avg_rate5m是否能够在Console控制框中查找出时间序列数据。


