运行 NodeExporter 客户端数据源
NodeExporter 是 Prometheus 提供的一个可以采集到主机信息的应用程序,它能采集到机器的 CPU、内存、磁盘等信息。
我们从 https://prometheus.io/download/ 获取最新的 Node Exporter 版本的二进制包。
解压并运行
wget https://github.com/prometheus/node_exporter/releases/download/v1.1.2/node_exporter-1.1.2.linux-amd64.tar.gz

tar xvf node_exporter-1.1.2.linux-amd64.tar.gz
mv node_exporter-1.1.2.linux-amd64 /usr/local/bin/node_exporter
创建用户
groupadd prometheus
useradd -g prometheus -m -d /var/lib/prometheus -s /sbin/nologin prometheus
chown prometheus.prometheus -R /usr/local/prometheus
创建 Systemd 服务
cat > /etc/systemd/system/node_exporter.service << EOF
[Unit]
Description=node_exporter
Documentation=https://prometheus.io/
After=network.target
[Service]
Type=simple
User=prometheus
ExecStart=/usr/local/bin/node_exporter
Restart=on-failure
[Install]
WantedBy=multi-user.target
EOF
启动
systemctl start node_exporter

systemctl status node_exporter
● node_exporter.service - node_exporter
   Loaded: loaded (/etc/systemd/system/node_exporter.service; disabled; vendor preset: disabled)
   Active: active (running) since 三 2019-06-05 09:18:56 GMT; 3s ago
 Main PID: 11050 (node_exporter)
   CGroup: /system.slice/node_exporter.service
           └─11050 /usr/local/prometheus/node_exporter/node_exporter

systemctl enable node_exporter
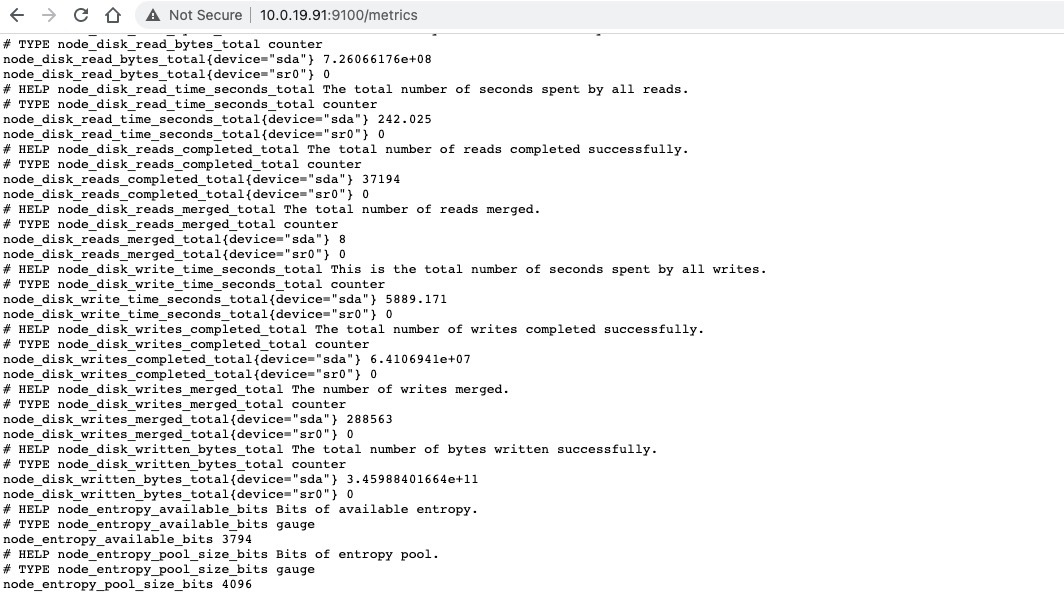
Node Exporter 默认提供给 Prometheus 的抓取地址为 http://IP:9100/metrics,你也可以直接打开:
配置prometheus
vim  /usr/local/prometheus/prometheus.yml

  - job_name: 'linux'
    static_configs:
      - targets: ['localhost:9100']
        labels:
          instance: node1
prometheus.yml中一共定义了两个监控:一个是监控prometheus自身服务,另一个是监控Linux服务器。完整的示例:
scrape_configs:

  - job_name: 'prometheus'
    static_configs:
      - targets: ['localhost:9090']

  - job_name: 'linux'
    static_configs:
      - targets: ['NODE_IP:9100']
        labels:
          instance: node1
重启 Prometheus
systemctl restart prometheus
访问Prometheus Web,在Status->Targets页面下,我们可以看到我们配置的两个Target,它们的State为UP。
Prometheus 针对 nodes告警规则配置
groups:
- name: example
  rules:

  - alert: 实例丢失
    expr: up{job="node-exporter"} == 0
    for: 1m
    labels:
      severity: page
    annotations:
      summary: "服务器实例 {{ $labels.instance }} 丢失"
      description: "{{ $labels.instance }} 上的任务 {{ $labels.job }} 已经停止了 1 分钟已上了"

  - alert: 磁盘容量小于 5%
    expr: 100 - ((node_filesystem_avail_bytes{job="node-exporter",mountpoint=~".*",fstype=~"ext4|xfs|ext2|ext3"} * 100) / node_filesystem_size_bytes {job="node-exporter",mountpoint=~".*",fstype=~"ext4|xfs|ext2|ext3"}) > 95
    for: 30s
    annotations:
      summary: "服务器实例 {{ $labels.instance }} 磁盘不足 告警通知"
      description: "{{ $labels.instance }}磁盘 {{ $labels.device }} 资源 已不足 5%, 当前值: {{ $value }}"

  - alert: "内存容量小于 20%"
    expr: ((node_memory_MemTotal_bytes - node_memory_MemFree_bytes - node_memory_Buffers_bytes - node_memory_Cached_bytes) / (node_memory_MemTotal_bytes )) * 100 > 80
    for: 30s
    labels:
      severity: warning
    annotations:
      summary: "服务器实例 {{ $labels.instance }} 内存不足 告警通知"
      description: "{{ $labels.instance }}内存资源已不足 20%,当前值: {{ $value }}"

  - alert: "CPU 平均负载大于 4 个"
    expr: node_load5 > 4
    for: 30s
    annotations:
      sumary: "服务器实例 {{ $labels.instance }} CPU 负载 告警通知"
      description: "{{ $labels.instance }}CPU 平均负载(5 分钟) 已超过 4 ,当前值: {{ $value }}"

  - alert: "磁盘读 I/O 超过 30MB/s"
    expr: irate(node_disk_read_bytes_total{device="sda"}[1m]) > 30000000
    for: 30s
    annotations:
      sumary: "服务器实例 {{ $labels.instance }} I/O 读负载 告警通知"
      description: "{{ $labels.instance }}I/O 每分钟读已超过 30MB/s,当前值: {{ $value }}"

  - alert: "磁盘写 I/O 超过 30MB/s"
    expr: irate(node_disk_written_bytes_total{device="sda"}[1m]) > 30000000
    for: 30s
    annotations:
      sumary: "服务器实例 {{ $labels.instance }} I/O 写负载 告警通知"
      description: "{{ $labels.instance }}I/O 每分钟写已超过 30MB/s,当前值: {{ $value }}"

  - alert: "网卡流出速率大于 10MB/s"
    expr: (irate(node_network_transmit_bytes_total{device!~"lo"}[1m]) / 1000) > 1000000
    for: 30s
    annotations:
      sumary: "服务器实例 {{ $labels.instance }} 网卡流量负载 告警通知"
      description: "{{ $labels.instance }}网卡 {{ $labels.device }} 流量已经超过 10MB/s, 当前值: {{ $value }}"

  - alert: "CPU 使用率大于 90%"
    expr: 100 - ((avg by (instance,job,env)(irate(node_cpu_seconds_total{mode="idle"}[30s]))) *100) > 90
    for: 30s
    annotations:
      sumary: "服务器实例 {{ $labels.instance }} CPU 使用率 告警通知"
      description: "{{ $labels.instance }}CPU 使用率已超过 90%, 当前值: {{ $value }}"


