例一
let inputValue = parseInt(Math.random() * 100);
myChart.setOption({
tooltip: {
formatter: "{a} <br/>{b} : {c}%"
},
series: [{
name: '1刻度',
type: 'gauge',
radius: '35%',
center: ['50%', '50%'],
startAngle: 220,
endAngle: -40,
axisLine: {
lineStyle: {
width:2,
color:[[1,'#8c929d']]
}
},
splitLine: {
length: 0,
lineStyle:{
color:'#8c929d',
width:2
}
},
axisLabel: {
show:false
},
axisTick:{
show:false
},
detail:{
show:false
},
pointer:{
show:false
}
},{
name: '2刻度',
type: 'gauge',
radius: '45%',
center: ['50%', '50%'],
startAngle: 212,
endAngle: -32,
axisLine: {
lineStyle: {
width:2,
color:[[1,'#8c929d']]
},
},
splitLine: {
length: 0,
lineStyle:{
color:'#8c929d',
width:2
}
},
axisLabel: {
show:false
},
axisTick:{
show:false
},
detail:{
show:false
},
pointer:{
show:false
}
},{
name: '3刻度',
type: 'gauge',//仪表盘
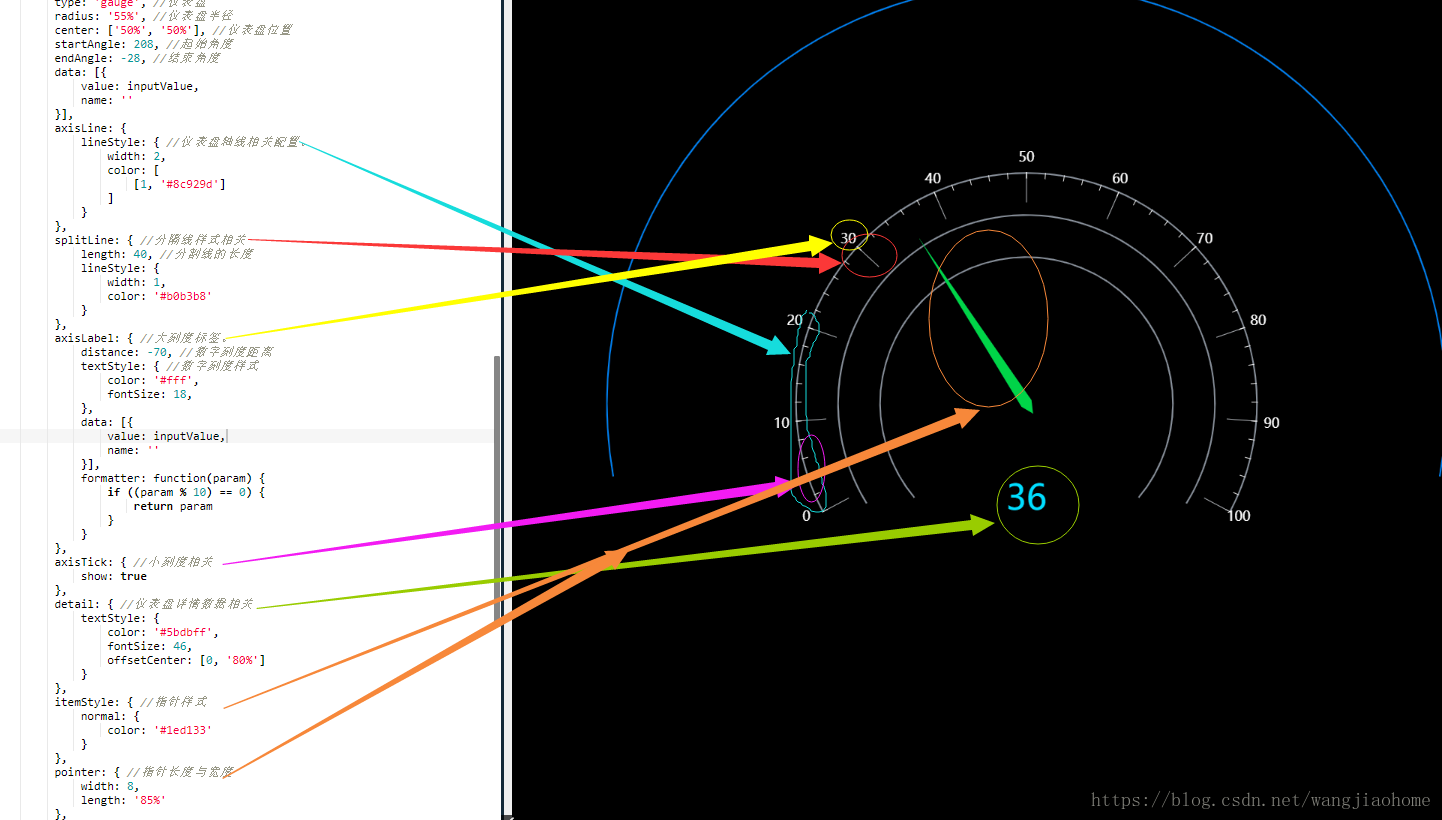
radius: '55%',//仪表盘半径
center: ['50%', '50%'],//仪表盘位置
startAngle:208,//起始角度
endAngle: -28,//结束角度
data: [{value: inputValue, name: ''}],
axisLine: {
lineStyle: {//仪表盘轴线相关配置。
width:2,
color:[[1,'#8c929d']]
}
},
splitLine: {//分隔线样式相关
length: 40,//分割线的长度
lineStyle: {
width:1,
color:'#b0b3b8'
}
},
axisLabel: {//大刻度标签。
distance: -70,//数字刻度距离
textStyle: {//数字刻度样式
color: '#fff',
fontSize:18,
},
data: [{value: inputValue, name: ''}],
formatter:function(param){
if ((param % 10)==0) {
return param
}
}
},
axisTick:{//小刻度相关
show:false
},
detail: {//仪表盘详情数据相关
textStyle: {
color: '#5bdbff',
fontSize:46,
offsetCenter: [0,'80%']
}
},
itemStyle:{//指针样式
normal:{
color:'#1ed133'
}
},
pointer:{//指针长度与宽度
width:8,
length:'85%'
},
data: [{
value:inputValue
}]
},{
name: '4线',
type: 'gauge',
radius: '100%',
center: ['50%', '50%'],
startAngle: 190,
endAngle: -10,
axisLine: {
lineStyle: {
width:2,
color:[[1,'#3d80f5']]
},
},
splitLine: {
length: -6,
lineStyle:{
opacity:0
}
},
axisLabel: {
show:false
},
axisTick:{
splitNumber:1,
lineStyle:{
opacity:0,
}
},
detail:{
show:false
},
pointer:{
show:false
}
}]
})
例二
1、外面那个外弧的实现,用两个表盘来实现。
2、表盘颜色的渐变(外表盘的)
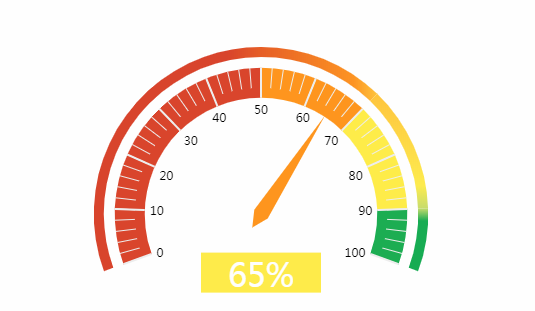
var option = {
         series: [
             {
                 type: "gauge",
                 center: ["50%", "45%"], // 仪表位置
                 radius: "80%",          // 仪表大小
                 startAngle: 200,        // 开始角度
                 endAngle: -20,          // 结束角度
                 axisLine: {
                     show: false,
                     lineStyle: {       // 属性lineStyle控制线条样式
                         color: [
                             [ 0.5,  new echarts.graphic.LinearGradient(0, 0, 1, 0, [{
                                 offset: 1,
                                 color: "#E75F25" // 50% 处的颜色
                             }, {
                                 offset: 0.8,
                                 color: "#D9452C" // 40% 处的颜色
                             }], false) ], // 100% 处的颜色
                              [ 0.7,  new echarts.graphic.LinearGradient(0, 0, 1, 0, [{
                                 offset: 1,
                                 color: "#FFC539" // 70% 处的颜色
                             }, {
                                 offset: 0.8,
                                 color: "#FE951E" // 66% 处的颜色
                             }, {
                                 offset: 0,
                                 color: "#E75F25" // 50% 处的颜色
                             }], false) ],
                              [ 0.9,  new echarts.graphic.LinearGradient(0, 0, 0, 1, [{
                                 offset: 1,
                                 color: "#C7DD6B" // 90% 处的颜色
                             }, {
                                 offset: 0.8,
                                 color: "#FEEC49" // 86% 处的颜色
                             }, {
                                 offset: 0,
                                 color: "#FFC539" // 70% 处的颜色
                             }], false) ],
                             [1,  new echarts.graphic.LinearGradient(0, 0, 0, 1, [ {
                                 offset: 0.2,
                                 color: "#1CAD52" // 92% 处的颜色
                             }, {
                                 offset: 0,
                                 color: "#C7DD6B" // 90% 处的颜色
                             }], false) ]
                         ],
                         width: 10
                     }
                 },
                 splitLine: {
                     show: false
                 },
                 axisTick: {
                     show: false
                 },
                 axisLabel: {
                     show: false
                 },
                 pointer : { //指针样式
                     length: '45%'
                 },
                 detail: {
                     show: false
                 }
             },
             {
                 type : "gauge",
                 center: ["50%", "45%"], // 默认全局居中
                 radius : "70%",
                 startAngle: 200,
                 endAngle: -20,
                 axisLine : {
                     show : true,
                     lineStyle : { // 属性lineStyle控制线条样式
                         color : [ //表盘颜色
                             [ 0.5, "#DA462C" ],//0-50%处的颜色
                             [ 0.7, "#FF9618" ],//51%-70%处的颜色
                             [ 0.9, "#FFED44" ],//70%-90%处的颜色
                             [ 1,"#20AE51" ]//90%-100%处的颜色
                         ],
                         width : 30//表盘宽度
                     }
                 },
                 splitLine : { //分割线样式(及10、20等长线样式)
                     length : 30,
                     lineStyle : { // 属性lineStyle控制线条样式
                         width : 2
                     }
                 },
                 axisTick : { //刻度线样式(及短线样式)
                      length : 20
                 },
                 axisLabel : { //文字样式(及“10”、“20”等文字样式)
                     color : "black",
                     distance : 5 //文字离表盘的距离
                 },
                 detail: {
                     formatter : "{score|{value}%}",
                     offsetCenter: [0, "40%"],
                     backgroundColor: '#FFEC45',
                     height:30,
                     rich : {
                         score : {
                             color : "white",
                             fontFamily : "微软雅黑",
                             fontSize : 32
                         }
                     }
                 },
                 data: [{
                     value: 56,
                     label: {
                         textStyle: {
                             fontSize: 12
                         }
                     }
                 }]
             }
         ]
     };
myChart.setOption(option);


